How do the number of COVID-19 deaths compare to cancer, heart disease, and flu?
In March of this year, Prof. John Ioannidis speculated on the impact of COVID-19. Estimating a 1% fatality rate, he described a scenario in which the U.S. saw 10,000 deaths. At the time of writing, U.S. deaths stand at 238,246. Some people still doubt the severity of COVID-19. Prominent figures claim that the pandemic is no worse than ordinary flu. Survey data suggests 17% of the U.K. population oppose the public health measures enacted in September. By the end of the same month, COVID-19 had caused 57,347 U.K. deaths. But how does that compare to other causes of death often discussed in the media?
Last year, Our World in Data published an excellent analysis of whether the news reflects what we die from. Assuming similarity with the U.K. statistics, I used this as a starting point to select causes of death. I compiled the number of deaths in 2018 in the U.K. for the following:
- Cardiovascular disease[1];
- Cancer[2–4];
- Alzheimer’s disease and dementia[5];
- Sepsis[6];
- Influenza and pneumonia[7];
- Alcohol-related and drug-related[8];
- Suicide[9]; and
- Road traffic accidents[10–11].
I’ve included sepsis due to the increased public interest in recent years. Note that the sepsis figure is an average as the UK Sepsis Trust does not provide annual statistics. You can view this data and the code used to generate the below figures on Github.

To compare with COVID-19, I looked up the number of COVID-19 (57,347) and total U.K. (447,487) deaths up to and including the last week of September.[12] This yields the crude estimate that COVID-19 has caused 13% of U.K. deaths this year (figure 2). That’s almost half of both the 2018 rates of cancer and cardiovascular disease deaths (each 27%). Consider that both cardiovascular disease and cancer comprise a range of different diseases. COVID-19 is just one.

The Office for National Statistics uses World Health Organisation groupings when determining leading causes of death. These divide cancer and cardiovascular disease into their different types. Thus, for 2018 they report Alzheimer’s disease and dementia as the leading cause of death with 65,387 fatalities (note this differs from the Dementia Statistics Hub estimate). The total number of U.K. deaths in 2018 was 616,014. [13] A mortality rate of 13% would yield at 78,775 deaths in 2018. That’s higher than the leading cause of death.

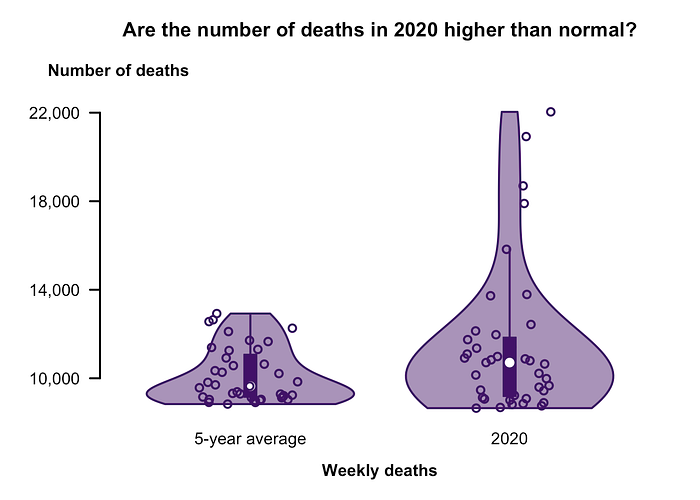
Of course, that 78,775 figure isn’t a prediction of the total number of 2020 COVID-19 deaths. That would assume a similar total number of deaths to 2018. We know already this is not the case. This year, we’ve seen 52,021 deaths more than the Office for National Statistics’ 5-year average (up to and including the week ending 2nd October). [12] In the worst weeks of the year, up to 22,038 people died, roughly twice what we’d expect to see. Additionally, co-morbidities like heart disease and dementia increase the COVID-19 mortality rate. Patients who would have died of other conditions will contribute to the COVID-19 total deaths.
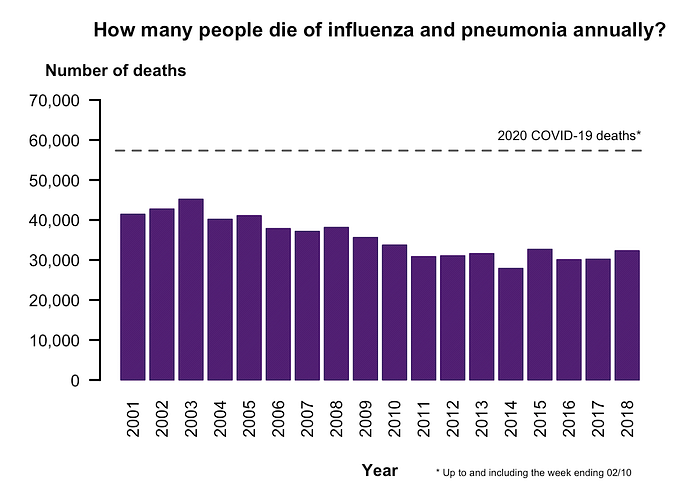
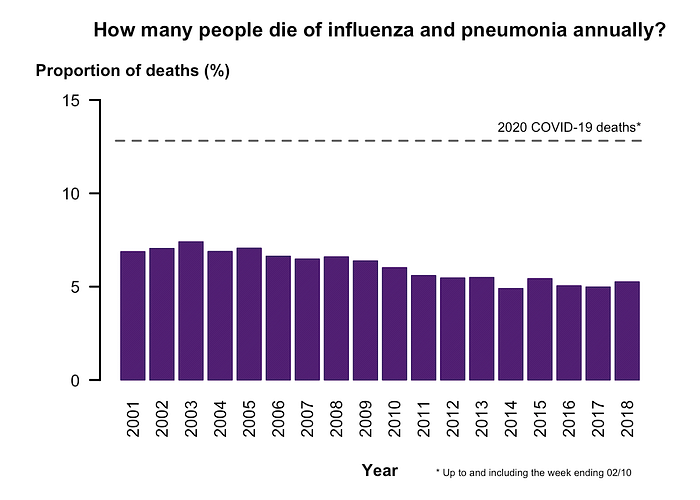
So what about the claim that COVID-19 deaths are no higher than a bad flu year? Google searches for ‘flu’ this year reached their highest since 2009, the year of the H1N1 pandemic. This suggests public interest in the comparison. In March, the World Health Organisation estimated that deaths as a proportion of COVID-19 cases are 3–4%. In contrast, the global seasonal flu mortality rate is 0.1%. I compared the number of COVID-19 deaths with 2001–2018 influenza and pneumonia deaths. Again, the COVID-19 deaths run up to and including the week of 2nd October. COVID-19 deaths outnumber influenza and pneumonia deaths by 12,142–29,443. As a proportion of annual deaths, influenza and pneumonia represent 4–7% of all deaths. That includes the 2017–2018 flu season, which was the worst the U.K. had seen in recent years.
The COVID-19 death tally discussed here ends as the U.K. second wave begins. COVID-19 hospitalisations are on the rise. Today (9th November), they’re at 65% of the peak seen during the first wave. September saw the first increase in monthly COVID-19 deaths since April. We know deaths lag 2–8 weeks behind the increase in cases. A new spike in COVID-19 deaths is on the way. We won’t know how deadly COVID-19 was in 2020 until late next year. If I were the sort of person who bet on tragedy, I’d put money down on COVID-19 being the leading cause of death in 2020. This in a country where up to 40% of people aren’t changing their behaviour to reduce the spread of the virus (e.g. improving hand washing, wearing a mask, avoiding crowded public places). If you’re interested in lessening this tragedy, that’s a good place to start.
Data
You can view all data and the code used to generate the above figures on Github.

Sources
- British Heart Foundation (2020) UK Factsheet
https://www.bhf.org.uk/-/media/files/research/heart-statistics/bhf-cvd-statistics-uk-factsheet.pdf? - ISD Scotland (2019) Cancer Mortality in Scotland: Annual update to 2018
https://www.isdscotland.org/Health-Topics/Cancer/Publications/2019-10-29/2019-10-29-Cancer-Mortality-Report.pdf - Northern Ireland Cancer Registry (2020) Number of deaths from cancer in Northern Ireland from 2000 to 2018
https://www.qub.ac.uk/research-centres/nicr/FileStore/OfficialStats2018/Filetoupload,957433,en.xlsx - Office for National Statistics (2020) Age specific rates, cancer deaths, England and Wales, 2018
https://www.ons.gov.uk/peoplepopulationandcommunity/birthsdeathsandmarriages/deaths/adhocs/12430agespecificratescancerdeathsenglandandwales2018 - Alzheimer’s Research U.K. Dementia Statistics Hub (2020) Deaths due to dementia
https://www.dementiastatistics.org/statistics/deaths-due-to-dementia/ - The U.K. Sepsis Trust (2020) References & Sources
https://sepsistrust.org/about/about-sepsis/references-and-sources/ - Office for National Statistics (2020) Leading causes of death, UK: 2001 to 2018
https://www.ons.gov.uk/peoplepopulationandcommunity/healthandsocialcare/causesofdeath/articles/leadingcausesofdeathuk/2001to2018 - Office for National Statistics (2020) Avoidable mortality in the UK
https://www.ons.gov.uk/peoplepopulationandcommunity/healthandsocialcare/causesofdeath/datasets/avoidablemortalityintheuk - Samaritans (2020) Suicide facts and figures
https://www.samaritans.org/about-samaritans/research-policy/suicide-facts-and-figures/ - Department for Transport (2019) Reported road casualties in Great Britain: 2018 annual report
https://assets.publishing.service.gov.uk/government/uploads/system/uploads/attachment_data/file/834585/reported-road-casualties-annual-report-2018.pdf - NI Direct (2020) NI Road Safety Partnership
https://www.nidirect.gov.uk/articles/ni-road-safety-partnership - Office for National Statistics (2020) Deaths registered weekly in England and Wales, provisional
https://www.ons.gov.uk/peoplepopulationandcommunity/birthsdeathsandmarriages/deaths/datasets/weeklyprovisionalfiguresondeathsregisteredinenglandandwales - Office for National Statistics (2019) Vital statistics in the UK: births, deaths and marriages
https://www.ons.gov.uk/peoplepopulationandcommunity/populationandmigration/populationestimates/datasets/vitalstatisticspopulationandhealthreferencetables
